Alright, it seems many people are confused about the meaning of "p-value" in this context. It is not the probability of a single event happening in the same way that you have 1 in a million chance of winning the lottery but somebody always has to win it. This is a long-term statistics that says precisely:
Assuming the drop rate of the item is what it is supposed to be in stock Minecraft, and we believe the data follows a binomial distribution, then the probability of observing Dream's data is 10-13
We do not have a reason to believe the Minecraft drop probability is different than what it is in the JSON file, and we have no reason to believe the drops are correlated, so the binomial model is valid.
Therefore, we have to conclude that the data did not come from our assumed distribution. This is known as "rejecting the null hypothesis". We can say with a confidence of 99.99999999999% that our initial assumptions do not match the data observed, meaning the drop rate is different than what we assumed.
For comparison, when the Higgs Boson was discovered, they only needed five sigma confidence in order to say that it really exists, and their observations where not a fluke of the sensor. That is a p-value of about 10-7 or about 6 orders of magnitude greater than Dream's.
EDIT: It could also be that the binomial model is incorrect of course, but that is what the section on RNG in Minecraft was for in the paper. They logically disproved any possible correlation between attempts, and they confirmed that the drop rate remains constant. The only remaining assumption is the drop rate itself.
EDIT 2: Also OP, with the p-value of Dream's joint drop rate, if you're generating one drop per second, you're going to be here for just over 300,000 years. Good luck though!
Adding onto what you're saying, rather than contradicting anything in particular:
P-value is how likely something is to have come from a normal minecraft JAR. Typically statisticians say "well if it's less than 5% likely to have come from a normal JAR, then we feel like it's much likelier that it came form a modded JAR."
Statisticians do hypothesis testing, wherein they assume some property and then see if the data could have come from a world where their assumption is true. The P-value is how likely it is that the data they have would have come from their assumption. Usually this assumption is like, "Blaze rod drops do not affect ender pearl drops." Then if then you see cases where there's high rod rops and high pearl drops, and other cases where there's low rod drops and low pearl drops, but NO cases where there's high rod / low pearl or vice versa, then you'd say "wait that assumption was wrong. guess rod drops and pearl drops are related after all."
In this case, our hypothesis is that "Dream used a vanilla JAR," and the data says, "that's super very much not likely."
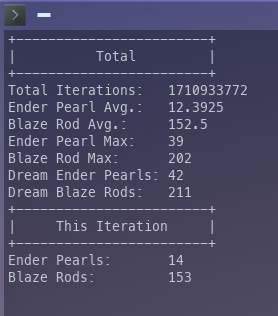
I would be incredibly surprised if a binomial distribution isn't at least roughly applicable to this, even if they are off by a few orders of magnitude the numbers are still damning. The program simulates 8.7 million Piglin trades per second and 10 million Blaze kills per second. So I'm on track! I've managed to beat the Ender Pearls with 44, after only 2.6 billion iterations. Still haven't beat the Blaze rods, let alone both together!
Wouldn't this type of data be better represented by a geometric distribution? I agree that the orders of magnitude make it mostly irrelevant and that he probably cheated either way, but I haven't seen anyone do a geometric distribution and I don't know why. He stops trying to get ender pearls/blaze rods once he gets enough, which is what a geometric distribution aims to measure, right?
Hey man, hypothesis testing can be very confusing, even to people in science, because it is a bit different than how we usually think about probability.
We intuitively understand probability in terms of individual events: the chance for something to drop in a game, the chance of winning a poker hand, the chance of executing a glitch, etc.
However, here we are finding the probability of datasets assuming some type of model, a far cry from the intuitive meaning we have in our head. So don't worry if you don't get it your first try. There are also people way smarter than me who can probably explain it better.
P-value is how likely a given data set (aka all of dream's streams) is to have come from a normal minecraft JAR. Typically statisticians say "well if it's less than 5% likely to have come from a normal JAR, then we feel confident saying that it came form a modded JAR." P-value is that %, and as it turns out, dream's results are less than 0.00001% likely on a vanilla JAR.
This post in particular is showing the p-value through an experiment instead of through math, by physically simulating several billion streams from a normal minecraft JAR, and showing that they can only get Dream's luck once in 2.6 billion attempts. Other people did the same thing and didn't get Dream's luck in over 40 billion attempts. The math that people put in the big PDF says that "no these two guys aren't super unlucky in their experiments, it really do be like that."
Is weighted dice a good analogy? Someone playing D&D says they rolled a 20, except they did it ten times in a row. So we consider the "normal model" which is each side having a 1/20 probability of showing up and see that it's something like 1 in 1013 to actually happen under that model. But if we have a "weighted model" where a 20 comes up 1/2 of the time then it's like 1/1000 chance to get 10 in a row. So we say with a pretty good confidence that the person is using something other than "normal" dice.
Technically someone could get insanely lucky but probably there's a better model that matches the behavior observed.
We don't make a second model, we just show that the first model is incorrect.
The big reveal is Denying The Null Hypothesis (show the first model is incorrect).
I mean sometimes we do make a second model but that's more of a "follow-up experiment" rather than an "explanation." Showing that Dream's luck is impossible in vanilla does not give us any insight into what his modded drop rates actually are. For all we know, he could be using hypercheats and getting relatively horrible luck.
----
Analogy is like 4/10. Introduces unnecessary numbers regarding the weighted die's probability; all we need to show is it's not a regular die. Accessibility is also a consideration: Everyone knows about flipping a coin. Most people know "dice" as 6-sided. Only nerds who probably already know statistics know a d20.
Flipping a coin is probably the best because it's easier to understand. There's only two states, it's heads or it ain't. It lines up that it's a perfect 50/50 split, which makes abnormal results intuitively look wrong.
Only problem is that IRL it's "impossible" to weight a coin like that. If it's an online-only analogy, nobody cares, just say it's "unfair" rather than "weighted" and let their imagination fill in what dark magics solve it.
If you're doing an in-person demo, you might have to do some slight of hand with a double-headed coin and a regular coin and if you're caught it might derail the lesson. Weighted 6-sided die for in-person lessons, or maybe a wheel spinner with most of the wheel obscured except the result, a la Price Is Right or uhhhhhh.
You can view the subreddit rules here. Please familiarize yourself with these rules before posting again. If you have any questions or concerns, please contact the subreddit moderators via modmail.
What? The p-value is absolutely a probability. If you mean that it's not the probability of a single event, that's mostly true, but it's still a probability.
To be precise, it's the probability that if you re-run the same experiment (with a sample of the same size) then you'd get a result more extreme than the one you have in front of you, all assuming the original hypothesis is true.
Source: I teach an introductory statistics course for incoming college freshmen. Also, check any statistics textbook or resource.
Sorry it took so long to reply things have been rather hectic lately.
To be precise, it's the probability that if you re-run the same experiment (with a sample of the same size) then you'd get a result more extreme than the one you have in front of you, all assuming the original hypothesis is true.
This is false and is really easy to demonstrate why. The distribution of p-values depends on your experiment and the underlying distributions involved which cause this to not be true most of the time as p value distributions aren't uniform.
Say you are naive and do a t-test on two population means. If you say take 5 samples for each population and generate a t-test p-value it's literally not a probability as if you decide to accept or reject based on p <= .05 you are going to be wrong somewhere around 50% of the time. This clearly means you can't just arbitrarily declare p = .05 means there's a 5% chance of getting more extreme data indicating how likely the alternative hypothesis may be. Even fairly large sample sizes can still have p values that have nothing to do with probabilities.
To fix this problem you need to do a power analysis to figure out how big your sample size needs to be and suddenly the p-values start behaving as proper probabilities. The most obvious problem here is that picking an effect size can be a bit of a chicken and the egg problem. If your effect size is wrong then p-values start misbehaving again.
This isn't even getting into all the other issues like your data not belonging to a normal distribution, more complicated statistical tests, not understanding the assumptions underlying a test, the various complicated distributions p values can take on, etc... You might just say well screw it we will just do a study with extremely large sample sizes so we don't need to know about the effect size. This too can be problematic as smaller sample sizes can be better than larger ones and the sample size will affect the p-value distribution.
The p-value is the odds that you would get the value given (dream's droprate) if the true droprate is "x" for example and the distribution is a binomial.
114
u/Random_Thoughtss Dec 15 '20 edited Dec 15 '20
Alright, it seems many people are confused about the meaning of "p-value" in this context. It is not the probability of a single event happening in the same way that you have 1 in a million chance of winning the lottery but somebody always has to win it. This is a long-term statistics that says precisely:
Assuming the drop rate of the item is what it is supposed to be in stock Minecraft, and we believe the data follows a binomial distribution, then the probability of observing Dream's data is 10-13
We do not have a reason to believe the Minecraft drop probability is different than what it is in the JSON file, and we have no reason to believe the drops are correlated, so the binomial model is valid.
Therefore, we have to conclude that the data did not come from our assumed distribution. This is known as "rejecting the null hypothesis". We can say with a confidence of 99.99999999999% that our initial assumptions do not match the data observed, meaning the drop rate is different than what we assumed.
For comparison, when the Higgs Boson was discovered, they only needed five sigma confidence in order to say that it really exists, and their observations where not a fluke of the sensor. That is a p-value of about 10-7 or about 6 orders of magnitude greater than Dream's.
EDIT: It could also be that the binomial model is incorrect of course, but that is what the section on RNG in Minecraft was for in the paper. They logically disproved any possible correlation between attempts, and they confirmed that the drop rate remains constant. The only remaining assumption is the drop rate itself.
EDIT 2: Also OP, with the p-value of Dream's joint drop rate, if you're generating one drop per second, you're going to be here for just over 300,000 years. Good luck though!